
In industry, "doing your best" is not a metric. To know if you are performing well, you must compare your reality to a standard. That is the role of Standard Hours.
Troisième volet de notre série "1 Mois, 1 KPI". Après avoir mesuré la présence (KPI n°1) et l'activité réelle (KPI n°2), nous introduisons maintenant la notion de Standard. Les Heures Théoriques sont le juge de paix : elles définissent ce que la production aurait dû coûter dans un monde idéal (ou du moins, normalisé).
The Challenge: Protecting Your Margins
If you sell a product for €100 estimating that it costs €20 in labor (based on 1 hour of theoretical work), but your teams consistently take 1.5 hours, you are losing margin on every unit produced. Without tracking Standard Hours, this drift is invisible until the year-end balance sheet. With this KPI, it becomes visible the moment a work order is completed.
This is a critical KPI for industrial CFOs: it validates the accuracy of your standard cost prices.
What do we mean by "Standard Hours"?
The goal is to keep a close eye on Standard vs Reality :
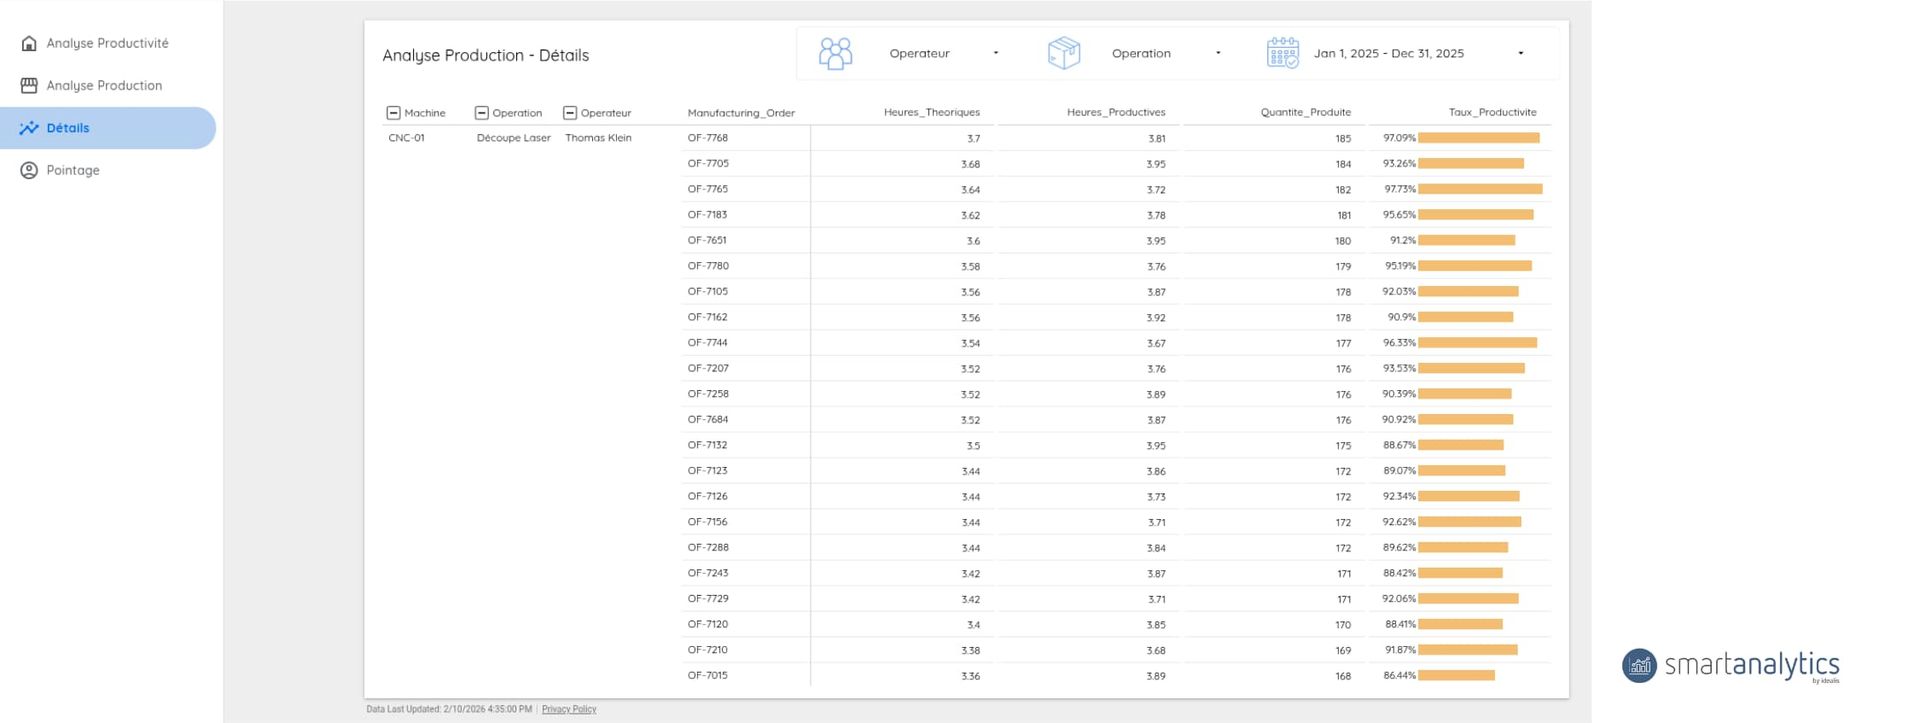
Standard Hours (or Allocated Hours) are automatically calculated by your ERP based on your Bill of Materials (BOM) and routing operations..
- The Principle: This is your performance contract. "To manufacture 100 parts, the routing allows 2 minutes per part; therefore, I allocate 200 minutes."
- Formula : Good Quantity Produced x Standard Unit Time (defined in BOM/Routing))
- Warning : This KPI depends 100% on the quality of your technical data. An obsolete standard (defined 5 years ago on an old machine) will skew the entire calculation.
🏭 Case Study : Mechanical Precision at Teconex
 Context :
Teconex is the producer of the famous "Teco" (an essential Belgian reference for electrical connections since 1932), is also synonymous with quality and innovation in lighting and EV charging stations.
Context :
Teconex is the producer of the famous "Teco" (an essential Belgian reference for electrical connections since 1932), is also synonymous with quality and innovation in lighting and EV charging stations.

Problem
Standard times defined in the routing operations were not systematically compared with the actual times recorded on the lines. Without this automated comparison, it was impossible to detect progressive drift—such as an assembly step planned for 3 minutes that regularly takes 4, or complex references undervalued in their BOMs. These invisible gaps distorted productivity calculations and complicated real capacity planning.

Idealis' Solution
Smart Analytics automatically calculates Standard Hours (Quantity Produced × BOM Standard Time) and compares them to the Productive Hours actually logged on each work order. The system immediately identifies references showing recurring discrepancies above a set threshold, eliminating the need for manual analysis.

Result
Teconex now has factual visibility into the gaps between standards and reality. This traceability has identified which routings require priority updates, allowing cost price revisions to be based on objective data rather than estimates. The methods department can now prioritize standardization efforts based on measured impact rather than field impressions.
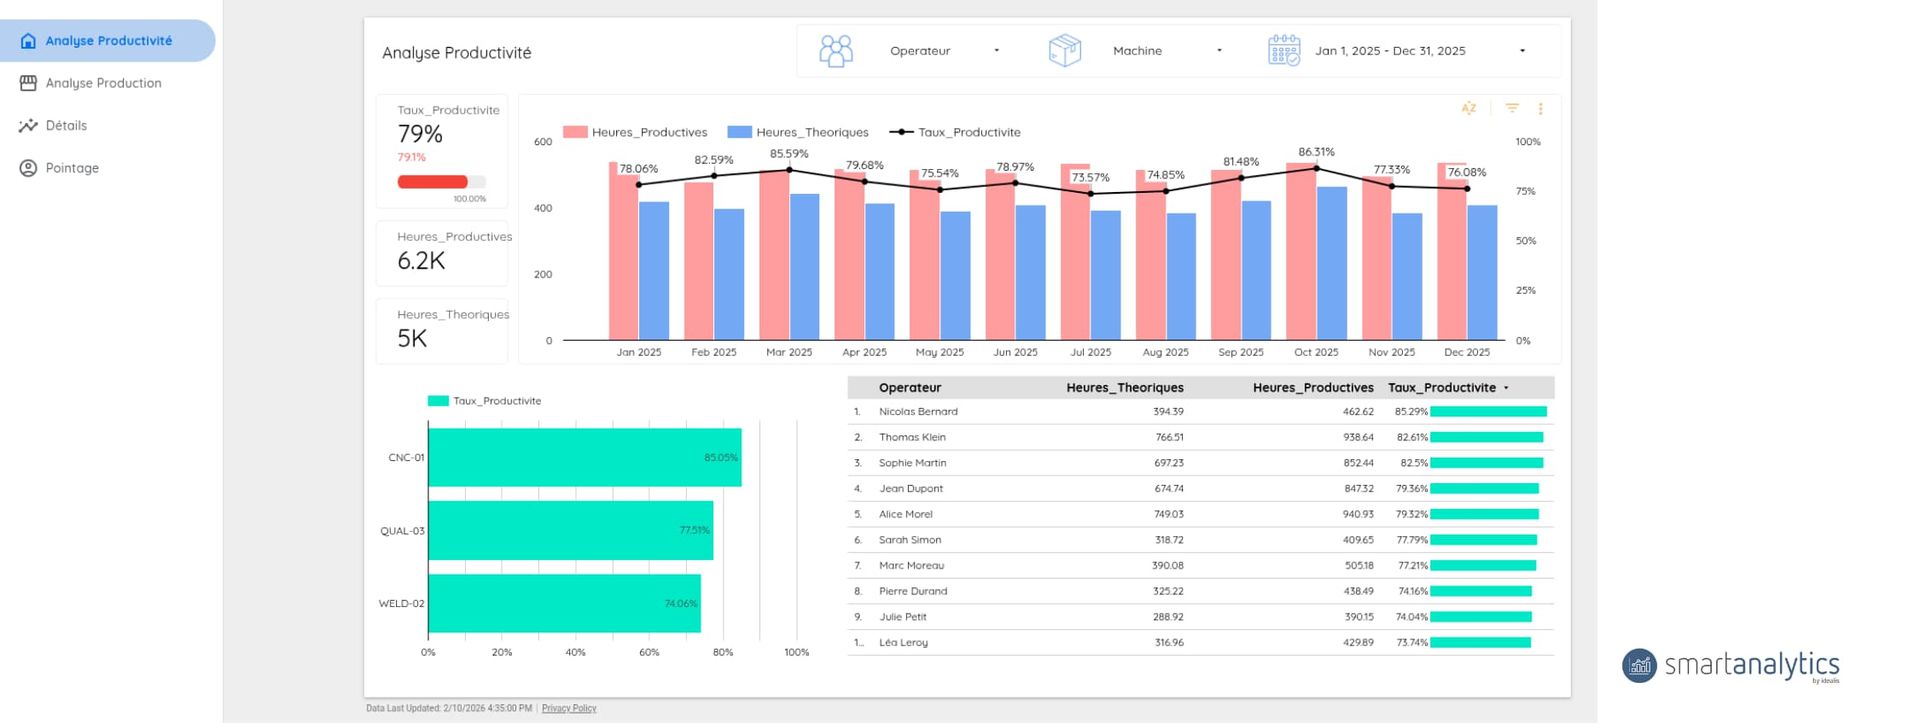
📊 Visualization : The "Bullet Chart" for Instant Comparison
For this KPI, visualization must be comparative. A single figure means nothing on its own.
With Smart Analytics, we prioritize :
- Le Bullet Graph (Comparative Gauge) :
- A horizontal bar represents Standard Hours (The Target)
- An overlaid bar represents Actual Productive Hours.
- Instant Reading: If the "Actual" bar exceeds the "Standard" bar, it turns red. You have "blown the time budget." If it stays below (green), you have over-performed.
- The Product Drift Matrix:
- A "Top 10" table of products with the largest negative variance (Actual Hours > Standard Hours). This tells your methods department which standards must be revised first.
Note: This is an example of what we have co-built with clients. Every dashboard is tailored to the specific needs and processes of your organization.
Your Action Plan in 3 steps
How Idealis ensures the accuracy of your standards to protect your industrial profitability?
Idealis automatically cross-references your theoretical routings with shop floor reality to identify cost drifts and adjust your cost prices in real-time.
Next in the series: We have the time, but do we have the volume? A deep dive into KPI n°4: Output Quantity. La Quantité Produite.
Are your cost prices based on obsolete standards? Our experts help you clean your data and automate your performance variance calculations.
Book Your Rapid Production Audit Below!👇