
Vous pouvez avoir beaucoup d'heures pointées (KPI n°1) et sortir beaucoup de pièces (KPI n°4), et pourtant perdre de l'argent. Comment ? En étant inefficace. Le Taux de Productivité est le seul juge de votre performance réelle.
We conclude our "1 Month, 1 KPI" series with the "King of Metrics." The one that synthesizes all others. The Productivity Rate (similar to Efficiency or OEE depending on the variation) is the ratio that interests Executive Management the most, as it directly impacts gross margin.
The Challenge: Flushing Out False Performance
Il est facile de produire 1000 pièces si on y met deux fois plus de personnel que prévu. L'enjeu du Taux de Productivité est de corréler les moyens engagés (Heures Productives) avec le résultat attendu (Heures Théoriques).
- The Inflationary Context: : With rising hourly labor and energy costs, a 5-point drop in productivity can be enough to push a production line from "green" (profitable) to "red" (operating at a loss).
What do we mean by "Productivity Rate"?
The goal is to know if You Are as Good as Planned:
This KPI compares the time you actually took against the time you should have taken according to your standards.
- Formula : (Standard Hours / Productive Hours) × 100
- Reading the Result:
- 100%: Perfect. You are producing exactly at the rate quoted.
- < 100% (e.g., 80%):Under-performance. You are taking longer than planned. You are losing money on labor.
- > 100% (e.g., 120%): Over-performance. Careful: either your teams are exceptional, or your standards (routings) are too loose and need revision.
🏭 Case Study : Operational Excellence at ACE
 Context :ACE is a factory specialized in manufacturing protective films with nearly 50 years of experience. They produce high-quality films and laminates for critical applications (surgical drapes, protective clothing, insulation). Quality requirements are exceptionally high, and manufacturing processes are complex.

Problem
Without a precise measure of hourly efficiency, it was impossible to tell if performance gaps stemmed from machine settings, recipe complexity, or the organization of parallel lines. Their existing tools (SAP) did not provide real-time operational visibility into the ratio of actual time versus theoretical time.
Idealis' Solution
Using Odoo coupled with Smart Analytics, ACE deployed a true "production cockpit" displaying the Productivity Rate by Work Order and by parallel line. Each team leader now has instant visibility into the gaps between Standard Hours and actual Productive Hours, allowing for immediate identification of performance drift without manual analysis.

Result
ACE gained operational efficiency through factual visibility. This transparency allowed for the rapid identification of problematic work orders (complex recipes, improper settings) and the subsequent adjustment of organization or standards. The improved ergonomics compared to SAP and the reduction in recurring IT costs completed the benefits of a solution that speaks the language of production, not just IT.
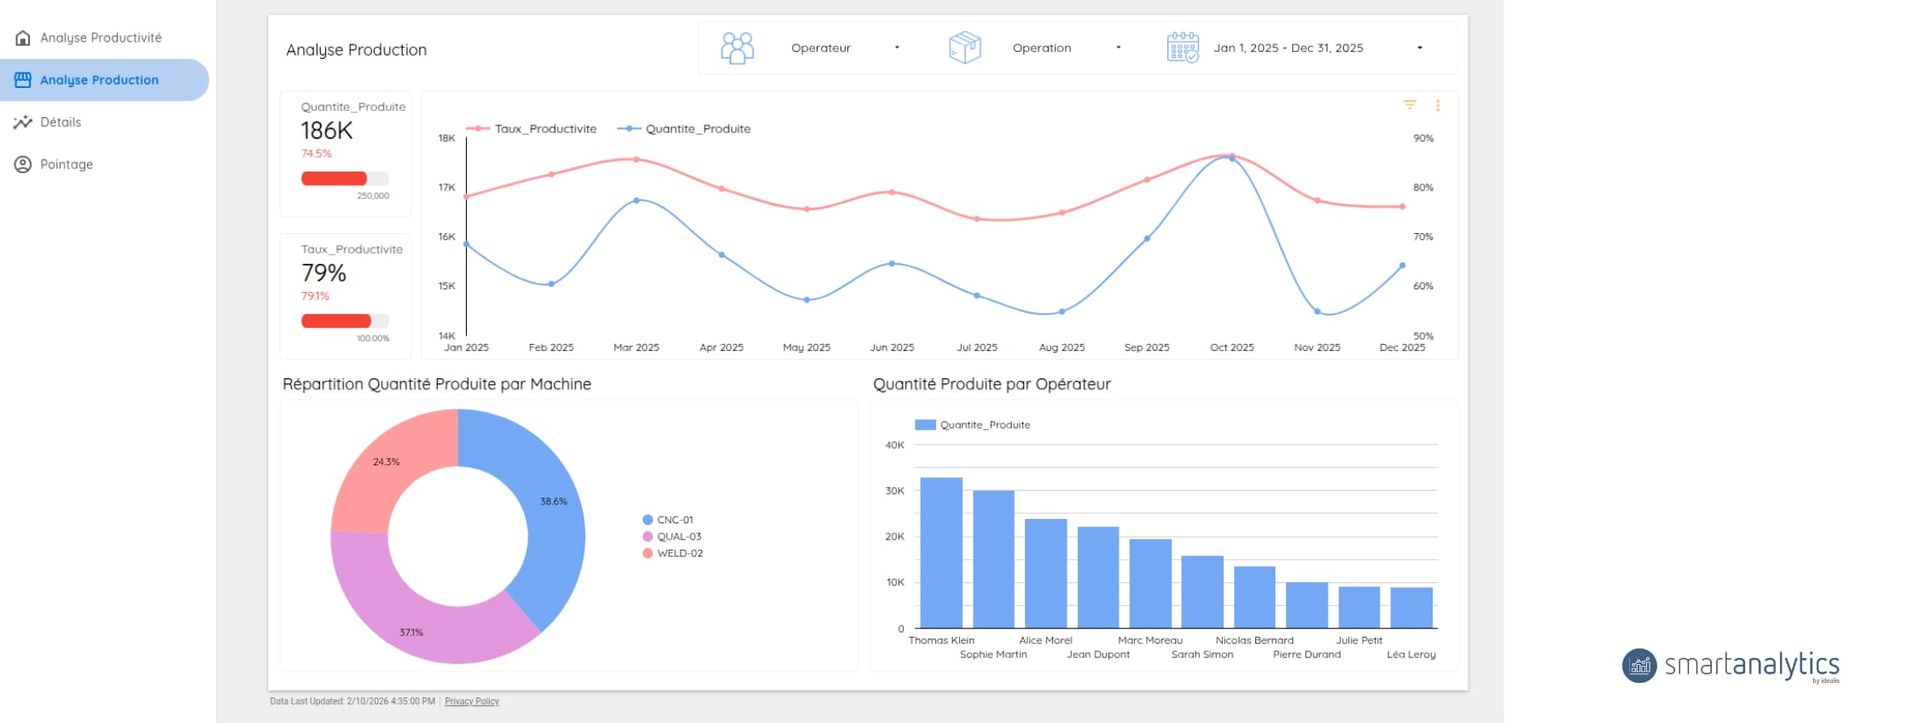
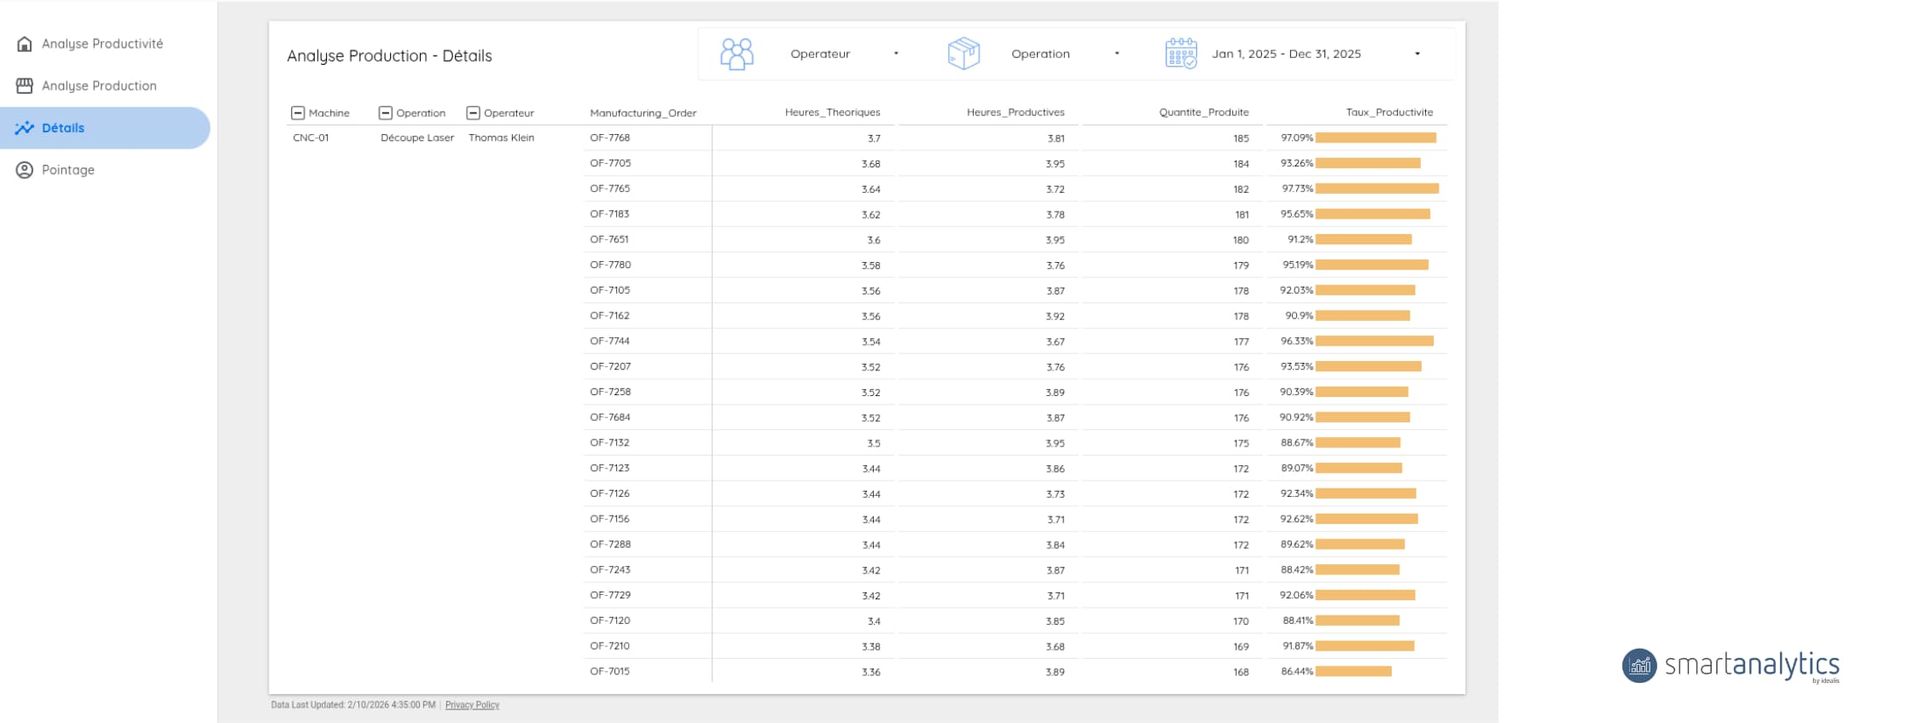
📊 Visualization : The Performance "Heatmap"
To analyze productivity, you need the ability to "drill down" into the data.
With Smart Analytics, the essential tool is the Heatmap:
- X-axis : Days of the week
- Y-axis : Production lines or teams.
- Cells : Colored from bright red (<80%) to dark green (>100%).
- Analysis: If an entire line is red all week, it’s a technical or structural issue. If red spots appear randomly, it might be a raw material issue or a one-off training need.
Note: This is an example of what we have co-built with clients. Every dashboard is tailored to the specific needs and processes of your organization.
Your Action Plan in 3 steps
How does Idealis transform your shop floor data into a true decision-making cockpit for your profitability?
Idealis deploys visual analytics tools that correlate your committed resources with your actual results to instantly identify performance levers and protect your gross margins.
The key: Do not treat this as a top-down control metric, but as a tool for dialogue and continuous improvement. When your teams understand the "score" and can act on it, performance follows naturally.
Ready to build your Production Cockpit?Idealis consultants are manufacturing sector experts. We speak your language, not just IT.
Book Your Rapid Production Audit Below! 👇