
Getting pallets out of the factory is one thing. Delivering the right quantity, at the right time, without overstocking or blocking shipments, is another. Output Quantity isn't just an end-of-day figure; it is the heartbeat of your Supply Chain.
Quatrième volet de notre série "1 Mois, 1 KPI". Après avoir analysé les temps (Pointés,Pointés,Productifs,Théoriques), nous passons au résultat concret : le Volume. Ce KPI semble être le plus évident, pourtant, c'est celui qui subit le plus de distorsions entre le "déclaré" atelier et le "comptabilisé" stock.
The Challenge: The Flow-Stock Balance
In manufacturing, producing "blindly" is dangerous.
- To little ? You create downstream bottlenecks, trucks leave empty, and late delivery penalties pile up.
- To much? You tie up cash in sitting Work-in-Progress (WIP) or finished goods, risking obsolescence.
The Production Manager's challenge is not just to maximize this number, but to level it so it perfectly matches demand (Takt Time) and logistical capacity.
What do we mean by "Output Quantity" ?
The goal is to aim for "Right First Time":
Output Quantity should not include scrap or parts awaiting rework. It is the validated quantity ready for transfer to inventory.
- Formula : Total Units (or kg/liters) reported at end-of-run - Scrap
- The Critical Nuance: You must distinguish between the "Reported Quantity" by the operator and the "Received Quantity" in stock. Discrepancies between these two are a frequent source of conflict between Production and Logistics.
🏭 Case Study : Volume Mastery at Nutradia
 Context :
Nutradia has been a key player in "healthy" snack production for over a decade, utilizing oil-free pressure-and-heat cooking technology. With a catalog of over a hundred specific recipes and a strong international presence, Nutradia manages significant volumes where precise reporting is vital.
Context :
Nutradia has been a key player in "healthy" snack production for over a decade, utilizing oil-free pressure-and-heat cooking technology. With a catalog of over a hundred specific recipes and a strong international presence, Nutradia manages significant volumes where precise reporting is vital.
Problem
There was a lack of visibility regarding the quantities actually produced by the lines after each production run. It was impossible to know in real-time if the volumes entering stock matched the planned targets. This "blindness" prevented the anticipation of delays or overproduction and complicated rapid planning adjustments.

Idealis' Solution
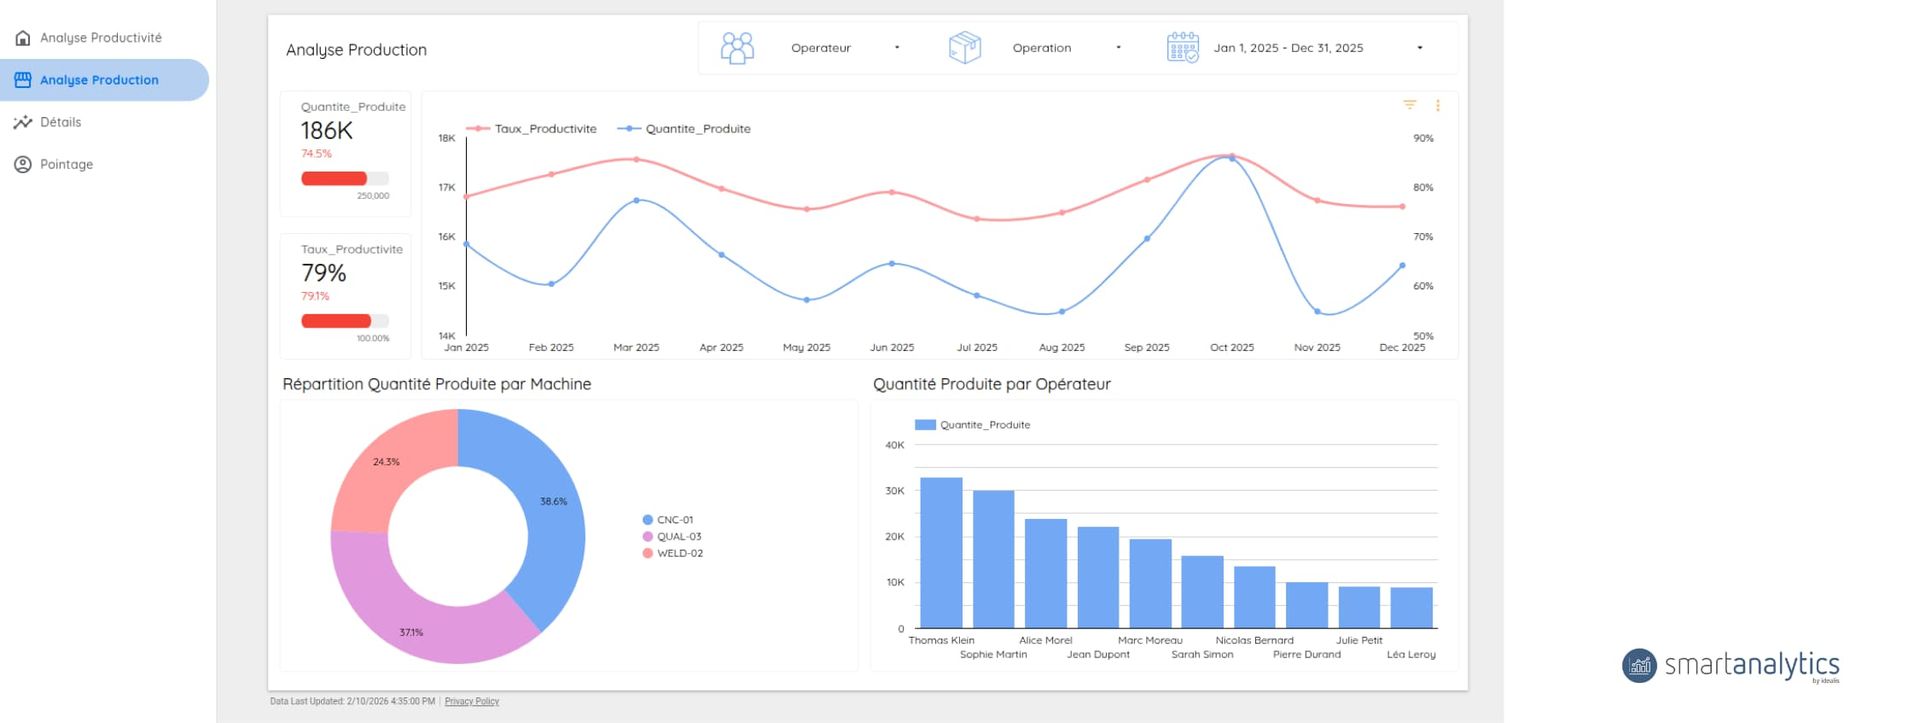
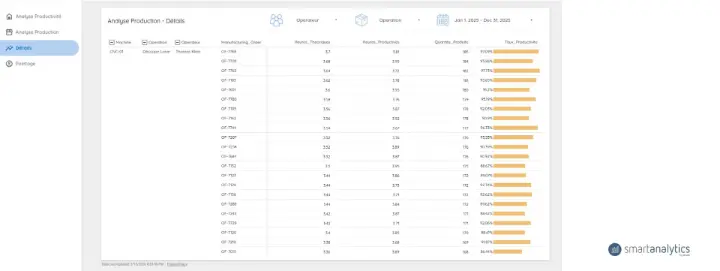
Through Odoo and Smart Analytics, Nutradia now utilizes a dashboard that analyzes daily quantities produced per hour on each line. The system automatically compares these actual volumes against planned production targets, providing immediate visibility into throughput gaps without manual analysis.

Result
Teams no longer discover underperformance at the end of the day or week. Real-time visibility allows them to immediately identify if a line is falling behind its target and adjust the organization (resource reallocation, priorities) mid-shift. This responsiveness ensures client commitments are met and optimizes available production capacity.
📊 Visualization : Tracking Pace in Real-Time
To manage quantity effectively, you must visualize Pace (Throughput).
With Smart Analytics, we recommend:
- The "Target vs. Actual" Gauge:
- A gauge that fills up throughout the day.
- Example: At 2:00 PM, the gauge should be at 750 units (Target). If it’s at 600, it shows in orange. The team lead sees immediately that they have a gap to close before the end of the shift.
- The Scrap Rate Histogram:
- Overlay "Good Output Quantity" and "Scrap Quantity" on the same chart. Producing 1,000 parts is useless if 200 go to the bin. This visual keeps teams accountable for quality as much as volume.
Note: This is an example of what we have co-built with clients. Every dashboard is tailored to the specific needs and processes of your organization.
Your Action Plan in 3 steps
How Idealis transforms your production volumes into a reliable and controlled logistical flow?
Idealis digitalizes your production reporting to synchronize your inventory in real-time and steer your manufacturing pace against sales targets.
Final article in the series: How do we know if this quantity was produced efficiently? See you for the ultimate KPI: The Productivity Rate. le Taux de Productivité.
Does your digital inventory never match physical reality? This is often a production reporting issue. Let’s audit your flows together. 👇