
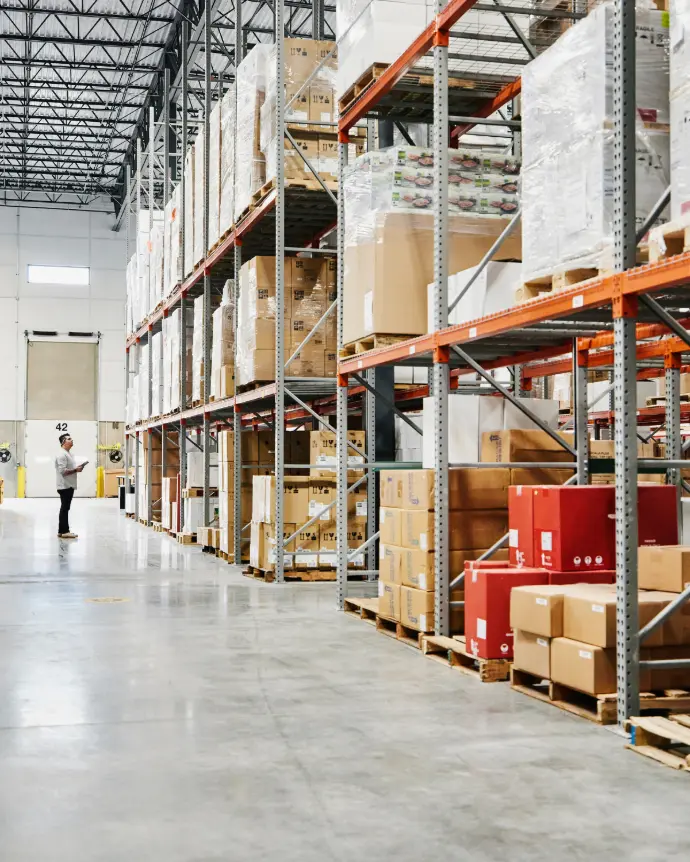
In an industrial landscape defined by volatile energy and raw material costs, managing a plant without real-time visibility is like flying blind. A lack of clear, reliable metrics is a costly liability, leading to production drift, invisible bottlenecks, unexplained yield gaps, and margins eroded by downtime..
Leveraging the right Key Performance Indicators (KPIs) is no longer optional for industrial leaders—it is the sine qua non for protecting margins and guaranteeing delivery. The era of Monday morning Excel exports analyzing last week’s data is over; Industry 4.0 demands real-time steering.
In this article, discover the 5 essential KPIs to regain control of your shop floor, maximize productivity, and unlock the full potential of your industrial data—powered by Smart Analytics integrated directly within your Odoo ERP.

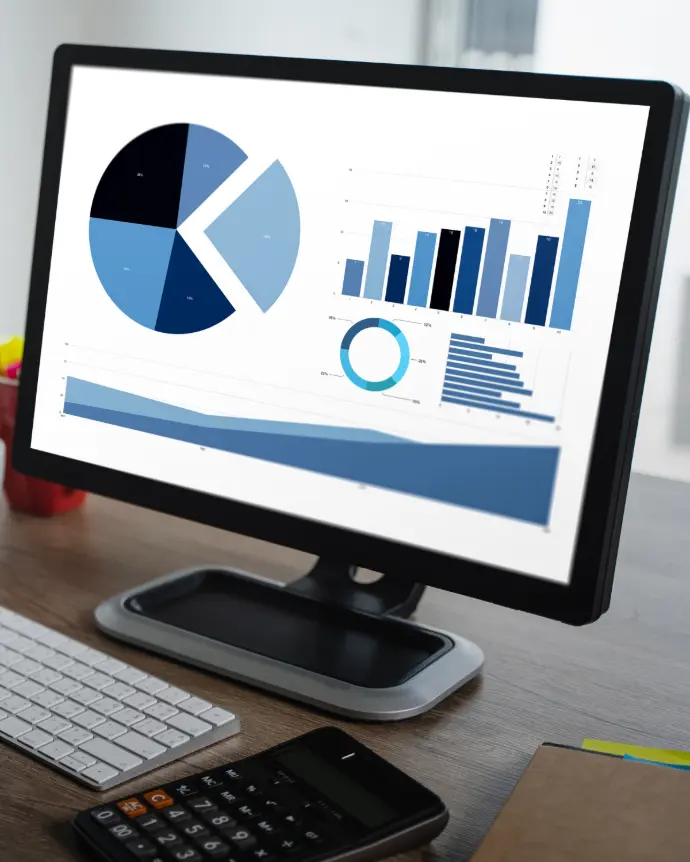
Here is an example of a supervision dashboard you could use every morning to analyze the performance of your production lines and teams.
Our Impact in the Manufacturing Sector
References that make a difference. We support the digital transformation of industrial leaders such as ACE (Engineering), Nutradia (Food & Beverage) and Teconex (Electrical Equipment). These industry players have chosen to digitalize their production tracking to enhance operational agility.
The 5 Production KPIs That Will Define 2026


KPI n°1: Logged Hours – Mastering Your Labor Costs
Gemini said KPI n°1: Logged Hours – Mastering Your Labor Costs Logged Hours represent the total attendance time of your operators in the plant, from clock-in to clock-out. This is the foundation of your payroll. Although basic, this indicator is often poorly correlated with actual production. A significant gap between paid hours and machine-worked hours often reveals organizational issues (changing room time, unregulated breaks, or excessive meetings).
- Action Lever: Analyze weekly discrepancies by team. If the ratio deteriorates, review the organization of entry/exit flows or break scheduling.
- Formula: (Clock out-Time) - (Clock in-Time)
KPI n°2: Productive Hours – Measuring Machine Engagement
This KPI isolates the time actually spent by your operators on Work Orders (WO). This is the time that directly creates value for the product. Tracking this KPI allows you to distinguish between direct and indirect labor. A drop in productive hours while logged hours remain stable is a red flag: are your operators spending too much time searching for materials, cleaning, or waiting for components?
- Action Lever: Use this data to launch continuous improvement projects (such as 5S or Lean) aimed at reducing unnecessary movement and waiting times at the line side.
- Formula: (Sum of Logged Hours) / (Work Orders (WO))

KPI n°3 : Heures Théoriques – L'étalon de votre performance

Standard Hours (or Theoretical Hours) represent the time production should have taken according to your standards defined in the Bill of Materials (BOM) and routing operations. This is your compass. If you don't measure this standard, you cannot know if you are making or losing money on a specific production batch.
- Action Lever: If there is a systematic discrepancy with actual time, your standards are likely obsolete. Update your routings in the ERP to refine your cost price calculations and load planning.
- Formula: (Quantity Produced) x (Planned Standard Unit Time)
KPI n°4: Output Quantity – The Pulse of Your Factory
Beyond simple volume, Output Quantity must be analyzed in relation to the resources deployed. This is your raw output indicator. Note: producing fast is not enough. This figure must be cross-referenced with your scrap rate (non-quality) to get an accurate picture of "Right First Time" production.
- Action Lever : Track the quantity produced per hour (throughput) to identify micro-stoppages or machine slowdowns that don't cause a full halt but kill your profitability.
- Formula: Total Units Manufactured (Validated at end-of-line)

KPI n°5 : Taux de Productivité – L'indicateur de vérité (Efficiency)
This is the ultimate KPI for a Production Manager. It measures the efficiency of your productive hours compared to the standard. A rate of 100% means your teams are producing exactly at the planned speed. Below 85%, your profitability is at risk. Above 110%, be careful: your standards may be undervalued, or quality may suffer.
- Action Lever : Segment this rate by work center or team. Identify "top performers" to understand their best practices and train teams that are struggling.
- Formula : (Standard hours ÷ Productive Hours) × 100
Is Your Production Driven or Merely Endured?
Get a free fast audit with Idealis Consulting. Our industrial experts will analyze your current metrics and the structure of your data within Odoo (or your existing ERP) to provide a strategic roadmap for reliable, precision management.
Request My Fast Production Audit
The mart Analytics Competitive Edge for Manufacturing
Why settle for static reports when you can drive your operations dynamically?
Real-Time & Multi-Site Visualization → With Smart Analytics natively integrated into Odoo, you can visualize these 5 KPIs in real-time. Whether you are at headquarters or on the shop floor, you have immediate access to your OEE (Overall Equipment Effectiveness) and work center load.
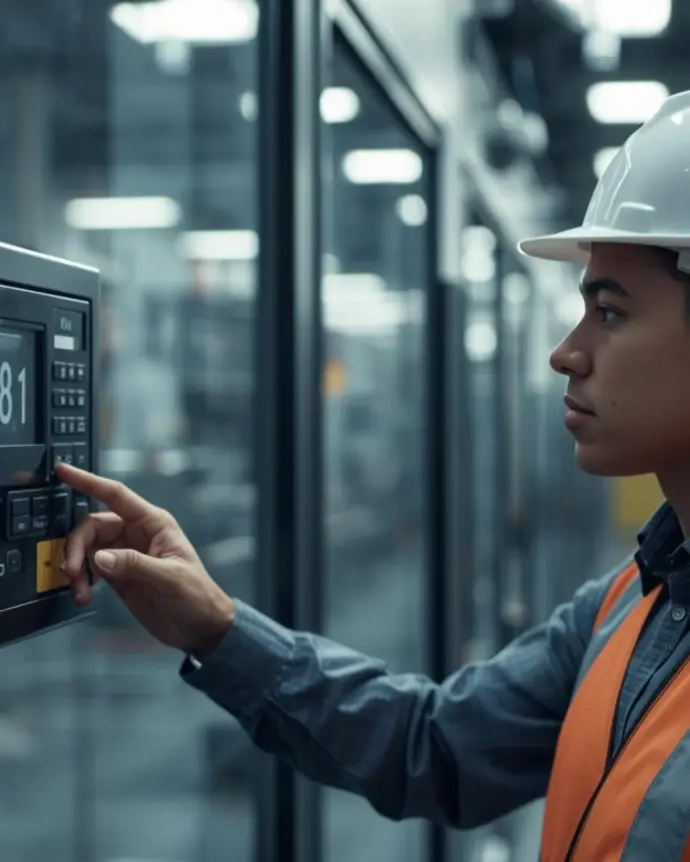
Direct "Shop Floor to Top Floor" Connectivity → Automation pulls data directly from workshop kiosks or machine sensors. Say Goodbye to Paperwork: Information flows in real-time, eliminating human error and processing delays.
Robust Architecture for Industrial Volumes → Our Data Warehouse architecture handles millions of production rows without slowing down your ERP. You can archive years of production data to analyze seasonality and long-term trends without impacting daily operational performance.
Proven in the Field!
Before Smart Analytics, we only discovered our productivity gaps at the end of the month during the accounting close. By then, it was too late to react. Today, if a line drifts, the shop floor manager sees it within the hour and can adjust. We gained 8 productivity points in just six months." — Industrial Director, Materials Processing Sector (Idealis Client)
Conclusion of our "1 Month, 1 KPI" Campaign
In 2026, industrial performance is no longer just about machine speed; it is about the surgical mastery of data. These five key indicators constitute the nervous system of your factory: they transform operational fog into a clear roadmap to secure your margins and empower your teams. By integrating these KPIs via mart Analytics and Odoo, you finally move beyond retrospective management and enter the era of proactive agility. Stop letting your profitability evaporate in the shadows of your production; transform every hour worked into a lever for sustainable growth.
FAQ – Your Questions on Production Management
The distinction is crucial for identifying "time waste" that isn't linked to operator performance, but rather to organization (waiting for materials, machine breakdowns, cleaning). This is where your immediate productivity gains are hidden.
Odoo captures the raw data (time tracking, work orders). However, cross-referencing calculations, historical data tracking, and dynamic visualization in a decision-making dashboard require an intelligence layer like Smart Analytics to be fully actionable for industrial management.
The key is simplicity. By using touchscreen kiosks or barcode scanners at the line side, you minimize entry effort. Smart Analytics then allows you to detect anomalies (e.g., an operator logged for 12 hours on a 2-hour order) for immediate correction.
Take Action Now
These 5 indicators are more than just numbers; they are a direct reflection of your industrial health. By tracking them rigorously, you shift from "firefighting" management (reacting to emergencies) to "strategic" management (anticipating and optimizing).
Take 30 minutes with an Idealis manufacturing expert: Walk away with a clear vision of how to transform your raw data into performance levers.
Schedule Your Free Audit Today and Secure Your Production Margins.